
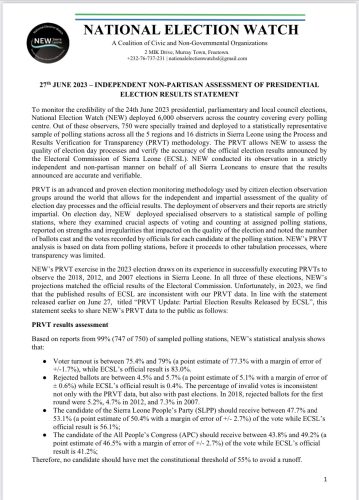
National Election Watch (NEW), an election monitoring group, has released its findings regarding the credibility of Sierra Leone’s presidential, parliamentary, and local council elections held on June 24th, 2023.
Deploying 6,000 observers across the country, including 750 specially trained individuals, NEW employed the Process and Results Verification for Transparency (PRVT) methodology to assess the quality of the election process and verify the accuracy of the official results announced by the Electoral Commission of Sierra Leone (ECSL).
According to NEW, the candidate of the Sierra Leone People’s Party (SLPP) should receive between 47.7% and 53.1% of the vote while ECSL’s official result is 56.1%; The candidate of the All People’s Congress (APC) should receive between 43.8% and 49.2% of the vote while ECSL’s official result is 41.2%.

Read full report below:
To monitor the credibility of the 24th June 2023 presidential, parliamentary and local council elections, National Election Watch (NEW) deployed 6,000 observers across the country covering every polling centre. Out of these observers, 750 were specially trained and deployed to a statistically representative sample of polling stations across all the 5 regions and 16 districts in Sierra Leone using the Process and Results Verification for Transparency (PRVT) methodology. The PRVT allows NEW to assess the quality of election day processes and verify the accuracy of the official election results announced by the Electoral Commission of Sierra Leone (ECSL). NEW conducted its observation in a strictly independent and non-partisan manner on behalf of all Sierra Leoneans to ensure that the results announced are accurate and verifiable.
PRVT is an advanced and proven election monitoring methodology used by citizen election observation groups around the world that allows for the independent and impartial assessment of the quality of election day processes and the official results. The deployment of observers and their reports are strictly impartial. On election day, NEW deployed specialised observers to a statistical sample of polling stations, where they examined crucial aspects of voting and counting at assigned polling stations, reported on strengths and irregularities that impacted on the quality of the election and noted the number of ballots cast and the votes recorded by officials for each candidate at the polling station. NEW’s PRVT analysis is based on data from polling stations, before it proceeds to other tabulation processes, where transparency was limited.
NEW’s PRVT exercise in the 2023 election draws on its experience in successfully executing PRVTs to observe the 2018, 2012, and 2007 elections in Sierra Leone. In all three of these elections, NEW’s projections matched the official results of the Electoral Commission. Unfortunately, in 2023, we find that the published results of ECSL are inconsistent with our PRVT data. In line with the statement released earlier on June 27, titled “PRVT Update: Partial Election Results Released by ECSL”, this statement seeks to share NEW’s PRVT data to the public as follows:
PRVT results assessment
Based on reports from 99% (747 of 750) of sampled polling stations, NEW’s statistical analysis shows that:
● Voter turnout is between 75.4% and 79% (a point estimate of 77.3% with a margin of error of +/-1.7%), while ECSL’s official result is 83.0%.
● Rejected ballots are between 4.5% and 5.7% (a point estimate of 5.1% with a margin of error of ± 0.6%) while ECSL’s official result is 0.4%. The percentage of invalid votes is inconsistent not only with the PRVT data, but also with past elections. In 2018, rejected ballots for the first round were 5.2%, 4.7% in 2012, and 7.3% in 2007.
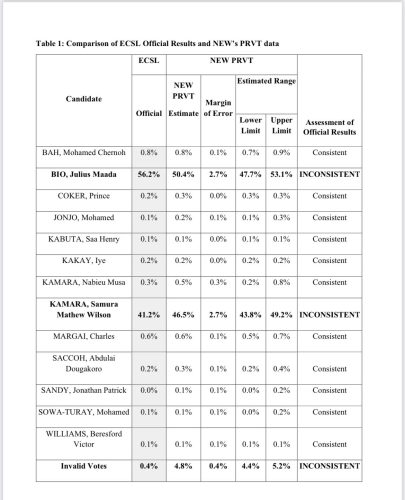
● The candidate of the Sierra Leone People’s Party (SLPP) should receive between 47.7% and 53.1% (a point estimate of 50.4% with a margin of error of +/- 2.7%) of the vote while ECSL’s official result is 56.1%; The candidate of the All People’s Congress (APC) should receive between 43.8% and 49.2% (a point estimate of 46.5% with a margin of error of +/- 2.7%) of the vote while ECSL’s official result is 41.2%;
● Therefore, no candidate should have met the constitutional threshold of 55% to avoid a runoff.
Analysis of Official Results
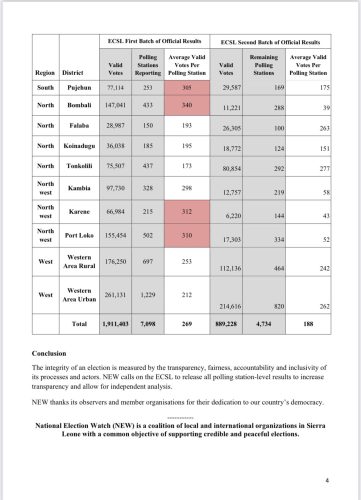
Based on the ECSL official release of results by district, NEW’s analysis shows there are inconsistencies in the results.
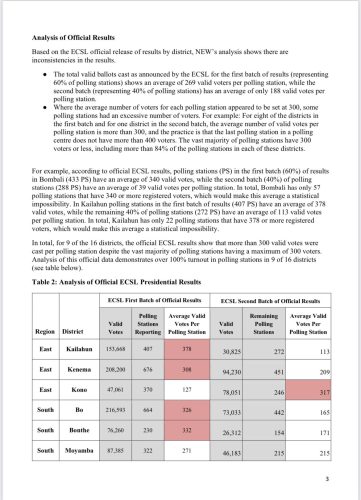
● The total valid ballots cast as announced by the ECSL for the first batch of results (representing 60% of polling stations) shows an average of 269 valid voters per polling station, while the second batch (representing 40% of polling stations) has an average of only 188 valid votes per polling station.
● Where the average number of voters for each polling station appeared to be set at 300, some polling stations had an excessive number of voters. For example: For eight of the districts in the first batch and for one district in the second batch, the average number of valid votes per polling station is more than 300, and the practice is that the last polling station in a polling centre does not have more than 400 voters. The vast majority of polling stations have 300 voters or less, including more than 84% of the polling stations in each of these districts.
For example, according to official ECSL results, polling stations (PS) in the first batch (60%) of results in Bombali (433 PS) have an average of 340 valid votes, while the second batch (40%) of polling stations (288 PS) have an average of 39 valid votes per polling station. In total, Bombali has only 57 polling stations that have 340 or more registered voters, which would make this average a statistical impossibility. In Kailahun polling stations in the first batch of results (407 PS) have an average of 378 valid votes, while the remaining 40% of polling stations (272 PS) have an average of 113 valid votes per polling station. In total, Kailahun has only 22 polling stations that have 378 or more registered voters, which would make this average a statistical impossibility.
In total, for 9 of the 16 districts, the official ECSL results show that more than 300 valid votes were cast per polling station despite the vast majority of polling stations having a maximum of 300 voters.


This Is Sierra Leone
The stage is set for inconsistencies its a carry forward process.
Young people’s integrity is at stake as this may be a copy cat thing I presumed.
God will hold them responsible for giving us this kind of result.
I’m really impressed with your information they are always accurate and true keep it up
It’s the same lawlessness. Where did they get their authority from. ECSL. Got its own thru the constitution.
It’s time we stop those foolishness. And embrace peace.
If pa kabbah dem been listened to dem kind opposition dressed in civil society. Lek tay now d war for dae on.
I remember, it’s was those same, civil sociaties that didn’t want the government to share power, in the interest of peace.
They get paid by the Whiteman, to create Chaos. So we can’t be stable.
APC itself knows, that they didn’t do proper preparation for elections. The campaign against the registration, against date. Up to the end, they threatened to pullout of the election. Only when they were told, it’s impossible.
Good news
Samba and NEW you can keep your results. We know you as a very strong APC member. Your so cled result has nothing to do with Sierra Leone. What matters to us is that ECSL boss with the constitutional mandate has spoken and that is final. Lonta babuyai oooooooo!!!
SIERRA LEONEANS THE TRUTH SHALL TRIUMPH ONE DAY.
LET’S KEEP THE FAITH.
PEOPLE ARE NOT JUST TO THEIR CONSCIENCE BECAUSE OF SELF INTEREST
This is the same lawlessness in our country, NEW does not have a constitutional mandate to collect the result, and therefore everything she did was thanks and void. These are the same people who want war in this country and we’re the SLPP na d Sierra Leone is not ready for such.
From her analysis, it’s vivid that HE Bio defeated SMW Kamara.
She just wants to create tension in this country, but let me remind her that this country has its sovereign powers and nobody goes against it either. Let her take the NEW result to the Supreme Court 😁😁😁😁😁😁😁😁
Congratulations,the only credible Civil society accredited and fit to have conducted this elections… Mohamed is an idiot fool hired to burried democracy…Bio and Mohamed your days are numbered God in heaven will ever judge your lives and generations just wait.
The only institution that has the right to announce Sierra Leone national elections result,is the ECSL. so who are you to announce elections results ? Please we are against war and we don’t want war again in this our beloved country. Please Stop this incitement that will create chaos for us as a nation. Congratulations messages has been sent by various political party representatives to show that, they have accepted the outcome of the results.
NEW, please also include the votes received by other political parties and viod votes in your projection. This will give us a comprehensive picture of your analysis. Kindly reshare after your revision taking these points into consideration.
NEW, please include votes from other political parties and viod votes into your analysis to give us a comprehensive picture.
Maada is not the winner is because people need peace majority of the nation is in favor of samura kamara now according to results Bio is the winner but his supporters is acting bad to the nation he will never do good things to the nation all his plan is bad but God will arrested one day
Bio and his supporters are all the same, even when they’re seeing the truth they are still writing nonsense, witches of Bio
We need peace and development on this time we all na salone people
The worrying thing is NEW will have no election to monitor after this election. As the PR system takes effect the issue of by-elections is now moot. NEW has no function till 2029. Bye!!
Hey guys let’s forget about the blames this is the time we should come together to build our beloved mama salone 🇸🇱 please let focus on how to build our beloved nation and even in the analysis the winer is prezo Bio but this is the time we should come together to build our beloved nation please 👏 Thank you.
This is Freetown, Sierra Leone were everyone is free to do there will…..
(NEW) you’re free this is Free Nation..
Wuna way dae support na wuna connect, with Pao Pao
In Sierra Leone today, our freedoms are vanishing. If you do not get active to take a stand now against all that is wrong while we still can, then maybe one of your children may elect to do so in the future, when it will be far more riskier — and much, much harder.
We should be fighting for Sierra Leone not political parties
God will surely justify
You can’t build on a faulty foundation and expect the building to stand
Good morning to this forum, i have gone through all the comment of people concerning the NEW woman .Sierra Leonians please let us be truthful to our concience and God. during the 2018 Election Masela Samba was talking on behalf of the SLPP to have a free and Credible Election but no body did raised any objections now that the table has turned arround you people start bashing at her but one thing i want to make clear here is, let us be mindful that we shall all give account of our Stewardship here after to our maker i.e God. None of us will escape Judgement..